
Case study · Bertelsmann Foundation · 2024
A series people looked for, watched and argued about
Six animated explainers to follow the 2024 U.S. election, from the primaries to the Electoral College. They came out one by one, at the pace of the campaign.
102,000
YouTube views across the six films, on the Foundation’s channel
10×
the views of a typical 2024 video on the channel, for the Electoral College film (55,962)
162
comments on the Electoral College film
01 · The result
On the Foundation’s YouTube channel, a typical 2024 video got about 5,500 views. The series added up to 102,000, not counting other platforms.
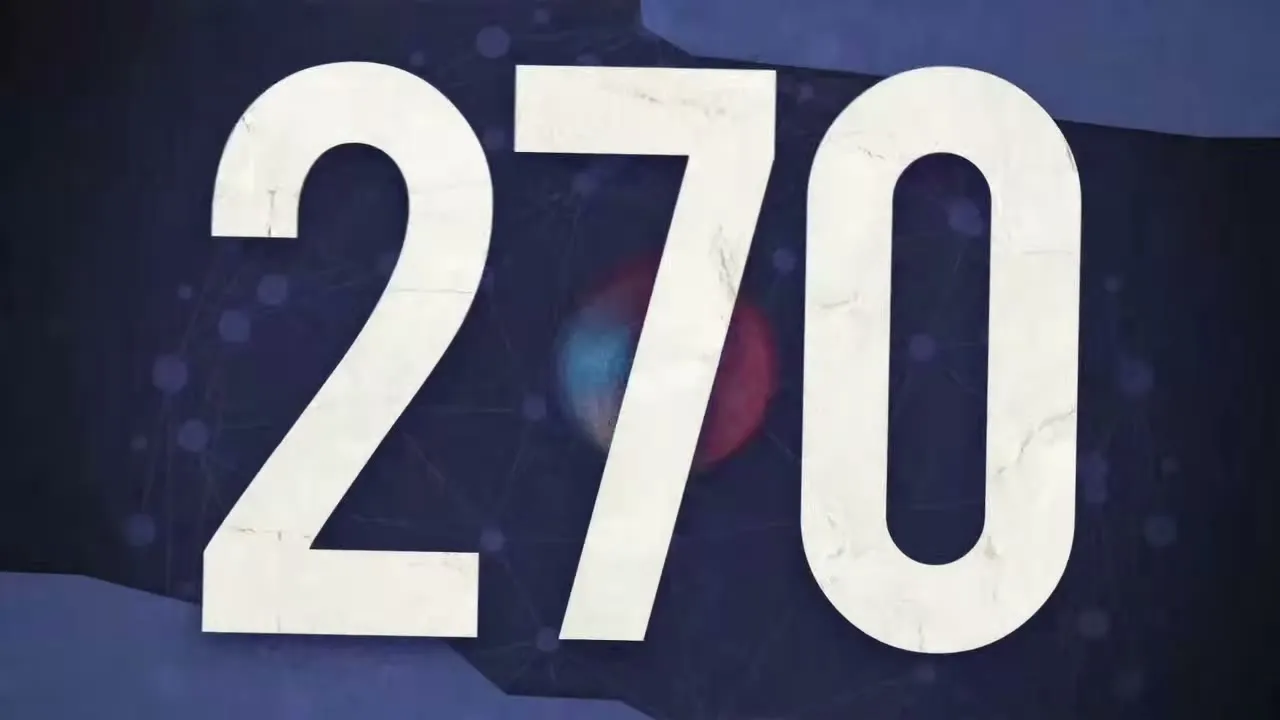
- How the Electoral College Works reached 55,962 views: ten times a typical video on the channel that year.
- It was also the most discussed in the series: 162 comments.
- Primary vs. Caucus, the first in the series, reached 25,066 views, more than four times the year’s typical video.
- All six get 0.80% to 1.43% likes per view, about double the channel’s norm (0.55%).
note: These are public YouTube metrics, checked in September 2026. We don’t know whether the Foundation promoted any of the films; the high like rate on all six suggests the views are organic. The other four episodes performed close to the channel’s typical video.
02
The challenge
In an election year, the Bertelsmann Foundation wanted to show a broad audience how the U.S. election really works: primaries and caucuses, the campaign issues, the judges, election security and the Electoral College.
These are topics almost everyone thinks they understand and few can explain. Every film had to be accurate and short, and back up the Foundation’s point with data.
The six came out between January and August 2024, narrated by Samuel George, each at its moment in the campaign.
03
The decisions

Cut paper, not infographics
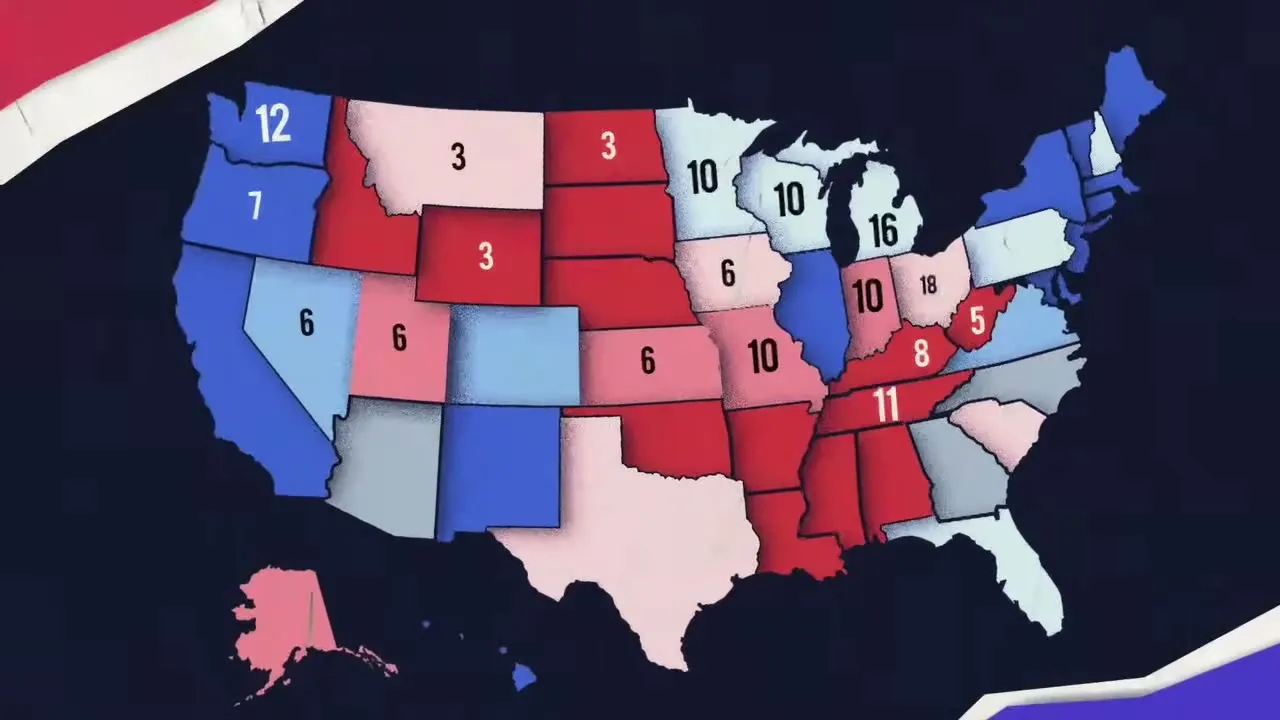
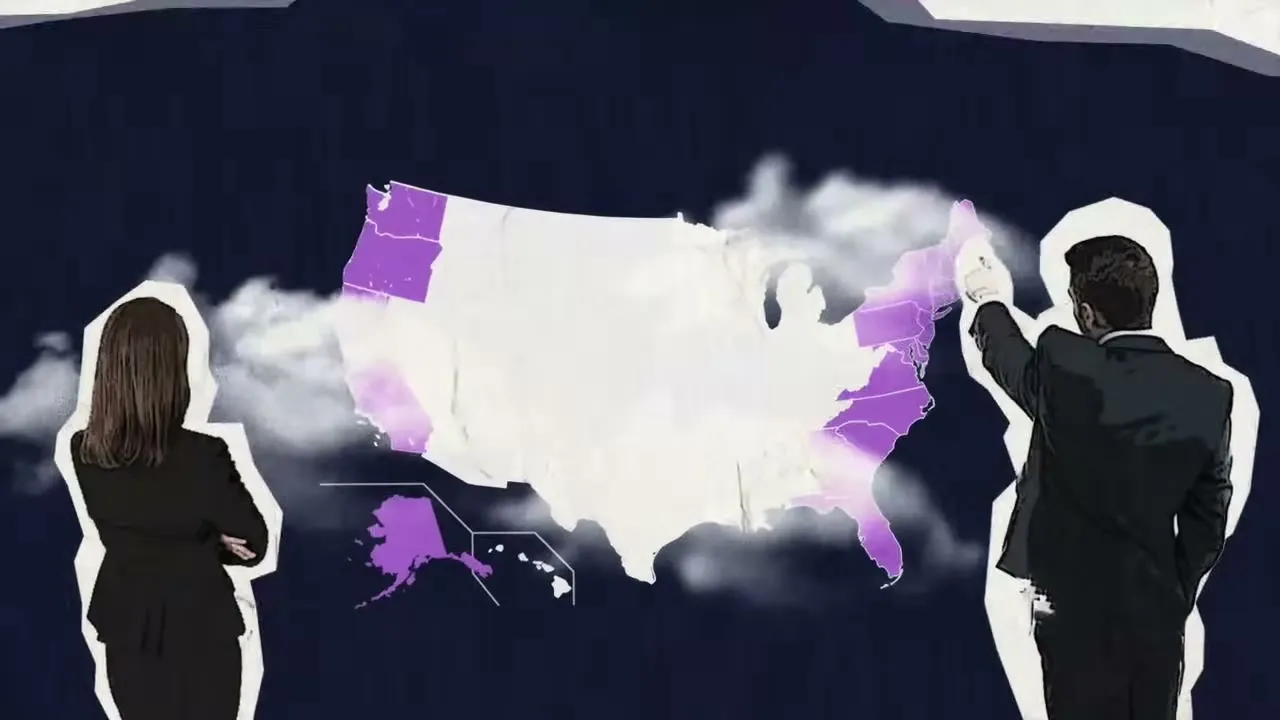
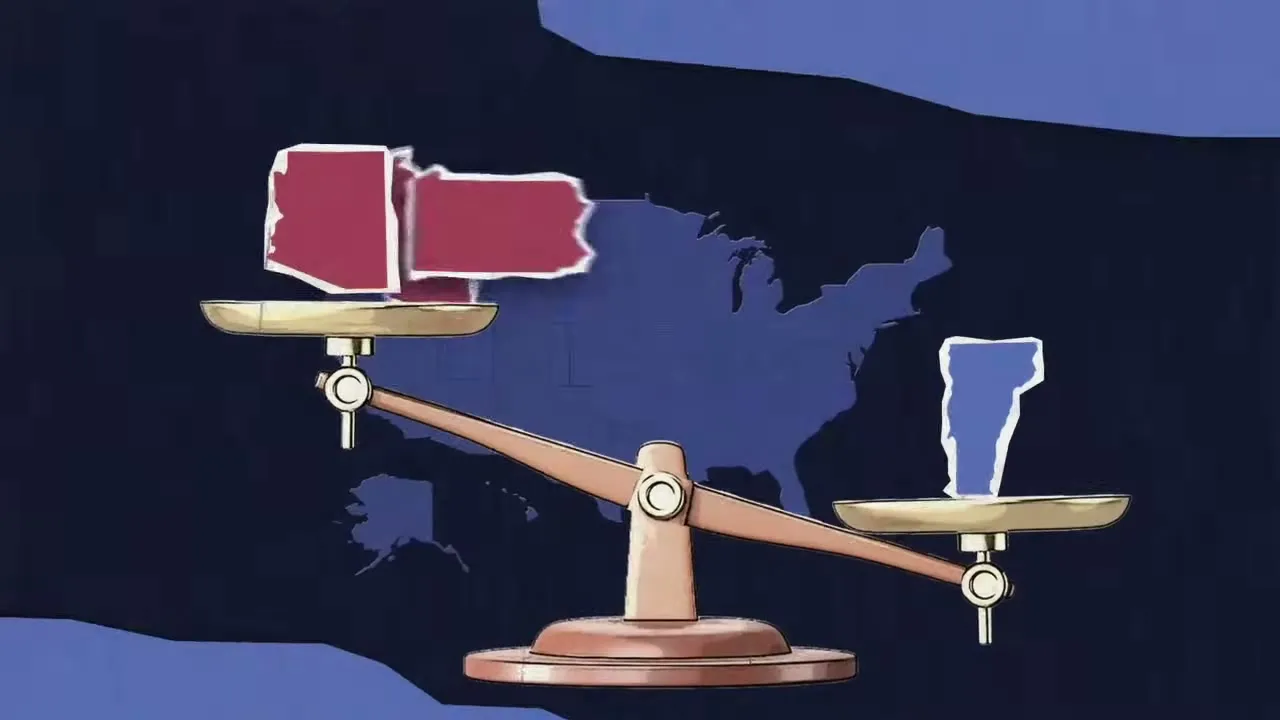
Maps, scales and people in torn-paper collage. It gives warmth and texture to a dry subject, and makes six films read as one series.
Every number, tied to something you can picture
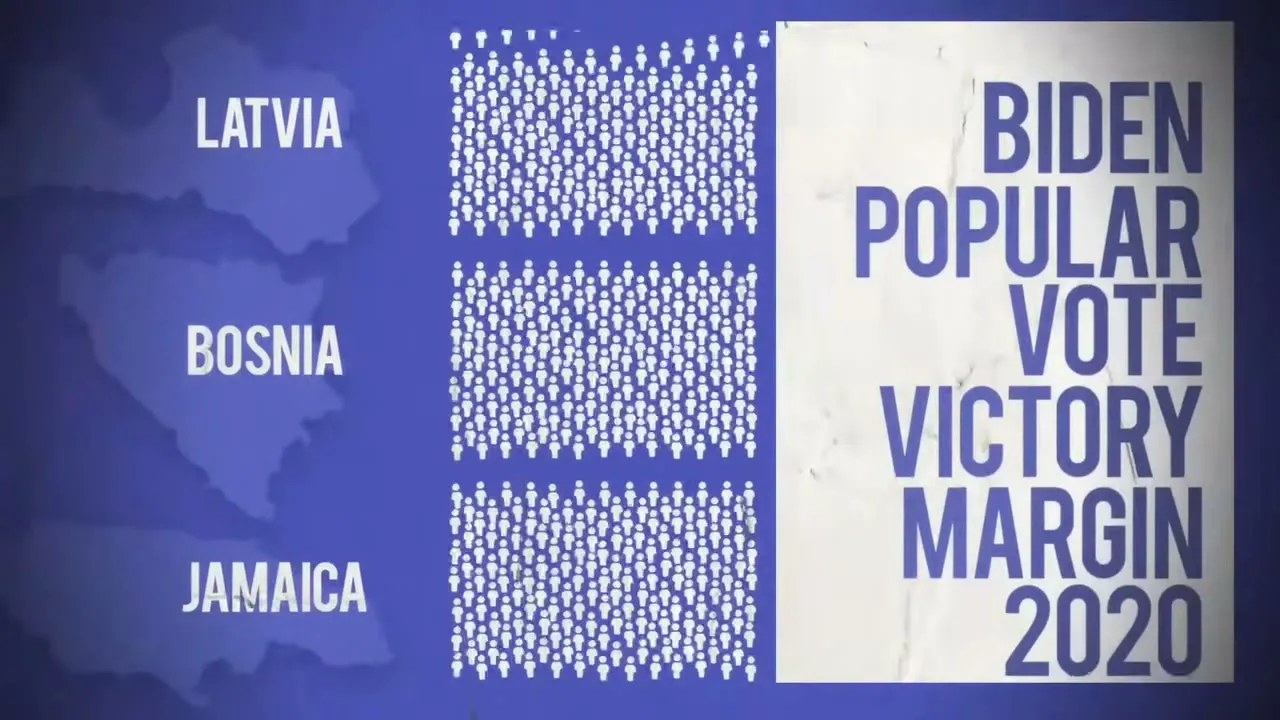
Seven million votes is abstract. Said as “the populations of Latvia, Bosnia and Jamaica combined”, it lands at once. Every figure got the same treatment.
A concrete example for the hard idea
That some votes weigh more than others is shown with two states on a scale: Vermont, which always votes the same way, against Pennsylvania, which can decide the election.
04
What it would cost today
The six films add up to about 30 finished minutes. With an annual bundle, they fall in the 16-minutes-or-more tier.
30 min × US$1,050 = US$31,500